
- U.S., India WTTC’s top tourism power rankings.
- Top 20 economies provide 81 percent of tourism GDP.
- Environmental efficiency up between 2019 and 2024.
THE U.S. LEADS the world in travel and tourism economic power, according to the World Travel & Tourism Council’s new Power, Efficiency & Opportunity Indices. But the indices show that economic scale does not determine a destination’s environmental or employment performance.
WTTC developed the “Power, Efficiency & Opportunity Indices” with Oxford Economics, in collaboration with OMRAN Group, and launched them Nov. 4 at WTM London. They assess 184 economies across three areas: economic power, environmental efficiency and employment opportunities.
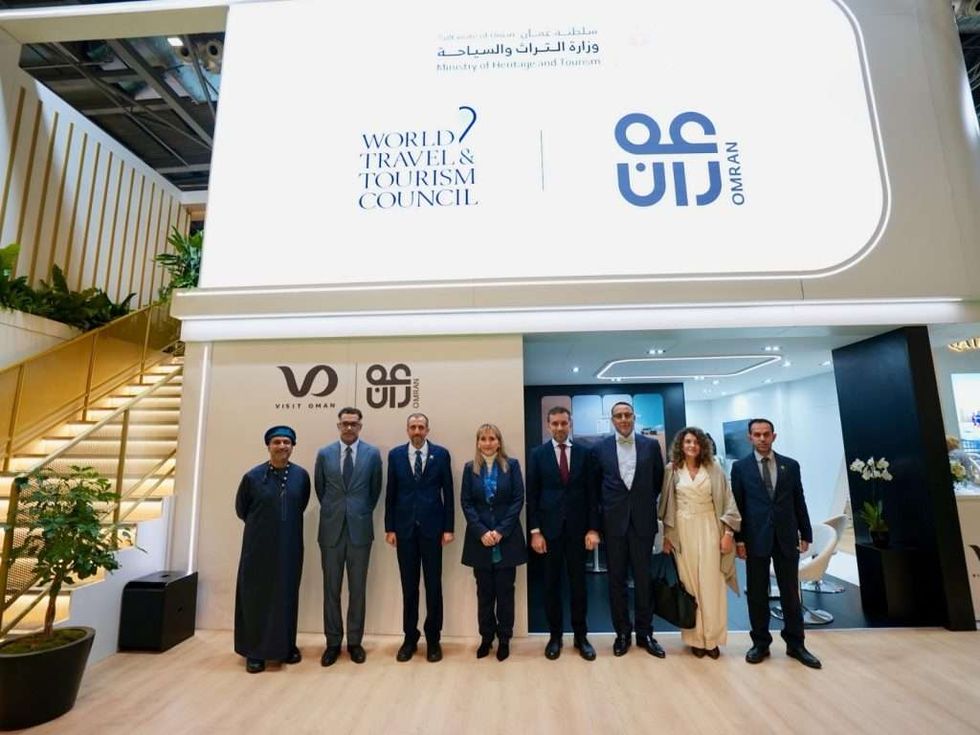 WTTC and Oxford Economics launch three indices assessing economic power, environmental efficiency and employment across 184 economies.Photo credit: World Travel & Tourism Council
“Travel and tourism is one of the world’s most powerful sectors, and these new Indices give us a broader and more holistic way to understand its impact,” said Gloria Guevara, WTTC president and CEO. “As the sector grows, we must focus on quality as well as quantity of growth. By assessing economic contribution, environmental efficiency and employment opportunities together, the Indices provide valuable insights to support sustainable growth and informed decision-making, while highlighting the sector’s ability to create opportunities for women and young people around the world.”
The indices measure tourism at the economy level, not hotel profitability.
WTTC said they are designed to help governments, investors and industry leaders benchmark destinations, identify gaps and inform investment decisions.
The findings come as U.S. hotel owners work to convert revenue growth into profit. In the Hospitality Asset Managers Association's Fall 2026 Industry Outlook Survey of 72 asset managers, 97 percent expected RevPAR growth to continue into 2027, but 61 percent forecast increases of just 1 percent to 3 percent, Asian Hospitality reported.
Respondents identified demand, wage increases and labor availability as leading concerns. Wage increases concerned 44 percent, while labor availability concerned 39 percent. The findings highlight the difference between growth in a tourism economy and the operating conditions facing hotels within it.
Power concentrated among top economies
 The top 20 economies accounted for 81 percent of global Travel & Tourism GDP in 2024.Photo credit: iStock
The Travel & Tourism Power Index measures economic scale through GDP, employment and investment. The top 20 economies accounted for 81 percent of global travel and tourism GDP in 2024. The U.S., China and India ranked first through third, followed by Germany, France, the U.K., Japan, Mexico, Spain and Saudi Arabia.
Some economies outperform on tourism investment or employment relative to their overall economic contribution, which WTTC said points to future growth potential. For investors and developers, this offers another basis for assessing markets beyond their current economic size.
The Environmental Efficiency Index compares tourism's environmental footprint with the economic activity it generates. It covers greenhouse gas emissions, low-carbon energy use, water consumption, air pollution and materials use.
The global score rose 2.3 points between 2019 and 2024. The low-carbon energy component improved 6.7 points, while greenhouse gas intensity improved 3.9 points. Sweden ranked first among high-income economies and Costa Rica among upper-middle-income economies.
WTTC said progress reflects long-term policy choices, environmental standards and investment in clean energy infrastructure.
Jobs for women and young people
 Tourism contributes substantially to overall employment in the Maldives, Grenada and Belize.Photo credit: iStock
The Opportunity Index measures employment share, employment growth, youth employment and female employment. Croatia led high-income economies, the Maldives led upper-middle-income economies, El Salvador led lower-middle-income economies and The Gambia led low-income economies. Tourism also accounts for a significant share of national employment in the Maldives, Grenada and Belize.
All three of Oman's PEO scores improved between 2019 and 2024. Women account for 28 percent of its tourism jobs, compared with 18 percent across the Middle East. Young people hold 13 percent of tourism jobs, against less than 9 percent across the Omani economy. Growth in GDP contribution and employment supported Oman's Power score, while progress in water use, air pollution and materials efficiency contributed to its environmental performance.
Eng. Ayad Al Balushi, CEO of OMRAN Group, said the indices change how tourism success is defined and measured by assessing efficiency, opportunity and lasting value alongside growth.
OMRAN Group, Oman’s leading tourism developer and the Sultanate’s executive arm for tourism development, uses the research to link tourism investment, destination development and long-term sustainability.
WTTC designed the three indices to be considered together. Destinations with economic power may have room to improve environmental efficiency or employment outcomes, while smaller economies can perform well in areas that economic scale does not capture.
Environmental Efficiency and Employment Opportunities results are grouped by World Bank income category to enable comparisons between economies with similar structural characteristics. WTTC's interactive dashboard provides the full results, allowing users to explore indicators, benchmark destinations and analyse performance across the three measures.