
PROFITS FOR U.S. hotels saw their highpoint of the pandemic in February, according to STR. However, occupancy fell by one percent in the last week of March compared to the previous week.
GOPPAR for February was $17.35, and 83.3 percent decline year over year but a highpoint for the year.
“GOPPAR had come in no higher than $12.69 for any month since the pandemic’s initial impact on industry performance last March,” STR said in its press release. “In addition to improved absolute levels in the profitability metrics, year-over-year comparisons were less steep.”
In January, GOPPAR was $3.14, at that time the highpoint since October.
TRevPAR for February was $85.11, down 67.4 percent year-to-year but up from $60.94 the previous month. EBITDA PAR was $0.14, down from $11.88 in January and a 99.8 percent drop from the last year. At $34.26, labor costs were down 60.2 percent from last year but up from $31.82 the previous month.
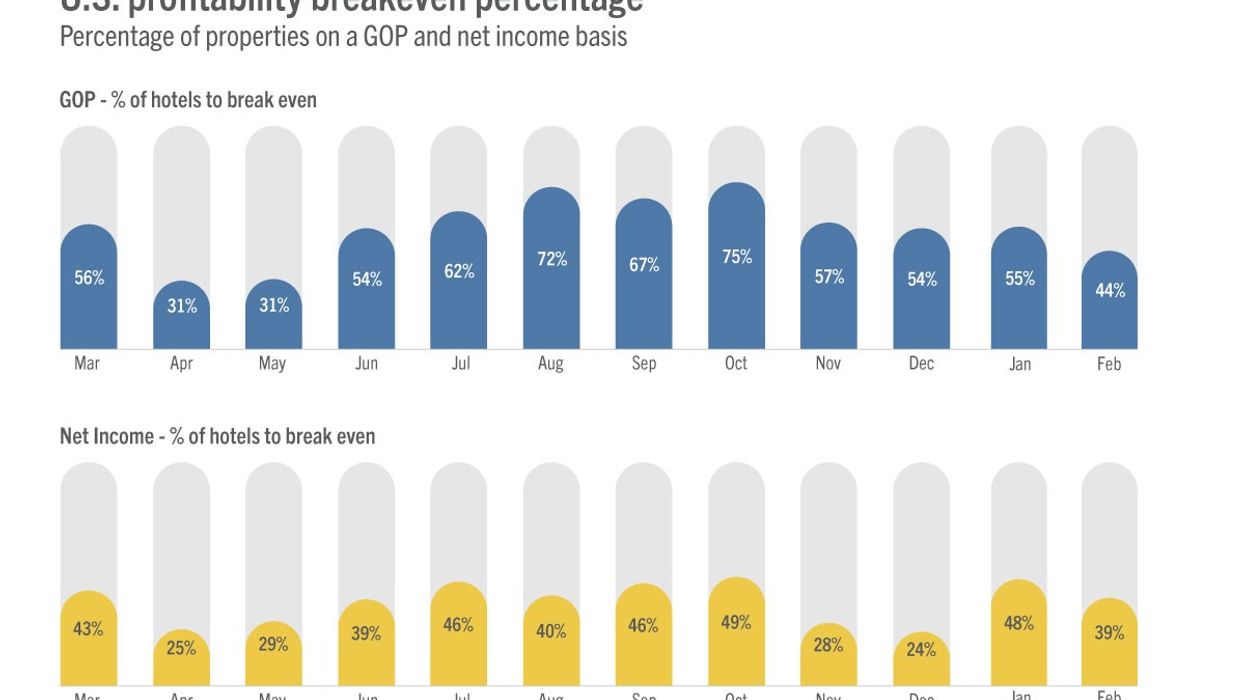
“Year-over-year percentage changes will turn positive in future P&L data releases due to comparison with pandemic low months last year,” said Raquel Ortiz, STR’s assistant director of financial performance. “Additionally, the industry’s top-line metrics have been trending at their highest levels in more than a year, as shown in our recent weekly data releases for March, and the uptick should extend to the bottom line as properties generate more room revenue while still maintaining operational efficiencies developed this last year. Roughly 50 percent occupancy is still the general break-even point for turning a profit, but only 44 percent of properties reached positive GOP territory in February—the percentage was lower on a net income level. With most of the demand in the marketplace being leisure-driven, the major markets, most dependent on business and group demand, continue to struggle the most even with some improvement last month.”
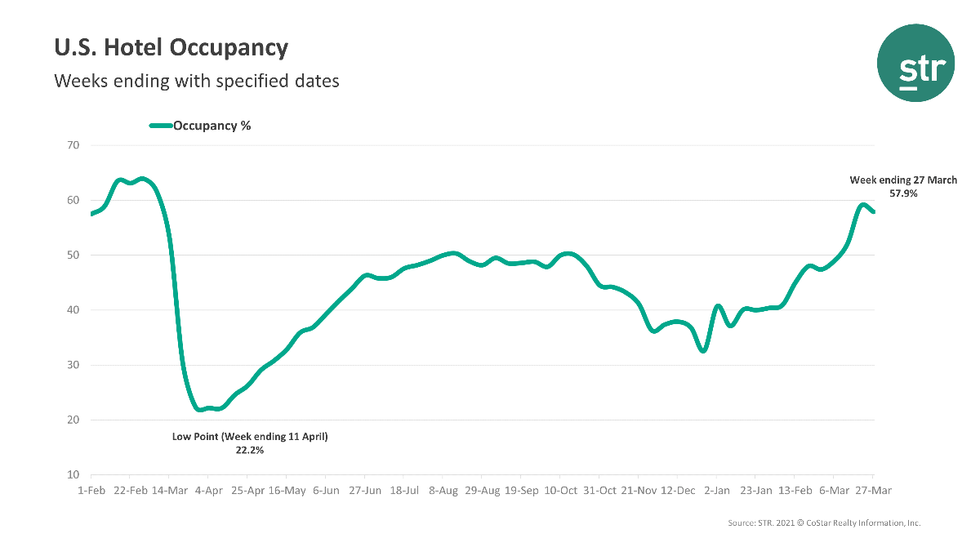
Occupancy in the week ending March 27 was 57.9 percent, down from 58.9 percent the week before. ADR was $108.31, flat from the previous week, and RevPAR was $62.68, down from $63.62 the prior week.
 Occupancy in the week ending March 27 was 57.9 percent, down from 58.9 percent the week before. ADR was $108.31, flat from the previous week, and RevPAR was $62.68, down from $63.62 the prior week.
“The 57.9 percent absolute occupancy was a 160.8 percent increase from the comparable, pandemic-affected week last year, but more importantly, represented more than 83 percent of occupancy regained from the 2019 benchmark,” STR said. “More than 21 million rooms were sold for the second week in a row, however, it was the first time in four weeks that the metric fell week over week, which is indicative of softening in the spring break demand that had boosted levels previously.”
Among STR’s top 25 markets, the highest occupancy was seen in Tampa, Florida, with 81.8 percent and Phoenix with 77.1 percent. The lowest occupancy levels came in Minneapolis with 38.4 percent and Boston with 38.6 percent.
The top 25 markets together had slightly lower occupancy than the rest of the nation with 55.9 percent but higher than average ADR at $115.92.
“The major markets continue to show the most sizeable gaps in current occupancy vs. comparable weeks from 2019,” STR said.