
THE 2020 COVID-influenced lodging industry recession resulted in some noticeable changes to the way hotels provide F&B service.
- Social distancing regulations forced operators to be creative in the way they served food and beverages to guests.
- Rising wage rates and sharp increases in the cost of food and beverage products compelled hotel managers to find ways to control costs.
- The inability of hotels to attract employees to fill the positions eliminated during the recession required creative solutions to improve productivity and offer more with less.
These factors resulted in the following hotel food and beverage trends during the subsequent recovery period:
- The increased offering of kiosks and grab-and-go venues
- The closing of traditional three-meal-a-day restaurants
- A reduction in the menus, number of seats, and hours of remaining F&B venues
- Reductions in in-room dining and mini-bar service
- The conversion of food and beverage space to other revenue generating purposes
To learn how these recent changes in hotel food and beverage operations have impacted revenues and expenses, we have analyzed the operating statements of 2,500 U.S. full-service, resort, and convention hotels that participated in CBRE’s annual Trends in the Hotel Industry in 2021 and 2022. In 2022, these 2,500 properties averaged 285 rooms in size, and achieved an occupancy of 64.7 percent, along with an ADR of $225.60. To provide more current information, we also relied on the monthly operating statements of 1,200 properties during the period January through June of 2023.
Revenue Trends
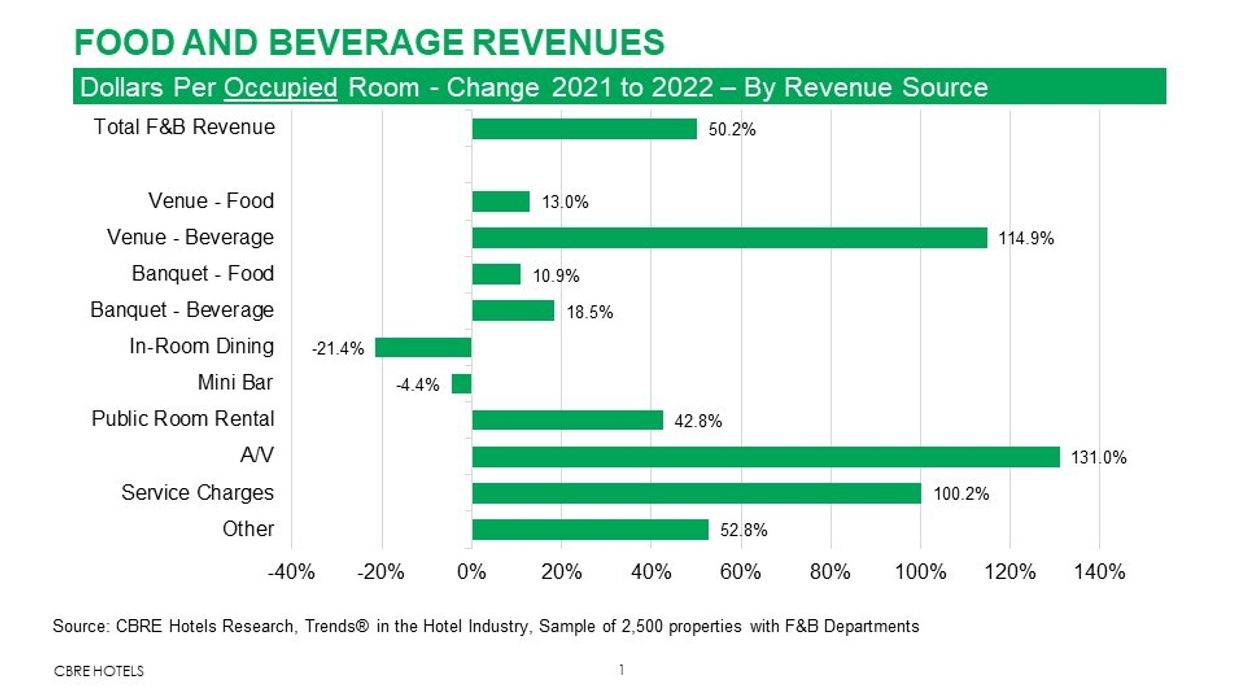
Since the majority of hotel food and beverage patrons come from in-house guests, it is appropriate to analyze revenue trends on a dollar-per-occupied room basis. From 2021 to 2022, total hotel F&B revenues POR for the hotels in the study sample increased by 50.2 percent. For comparative purposes, total hotel revenue for the same hotels increased 24 percent POR. This is consistent with the delay in the recovery of revenues linked to group demand (ex. catering and banquet revenue) during 2021.
F&B revenue sources exhibiting the greatest POR percentage increases during 2022 were beverage venue revenues, public-room rental, audio-visual revenue, and mandatory service charges. The rise in beverage venue revenues (bars and lounges) is consistent with the increased popularity of specialty cocktails and craft beers, along with the conversion of rooftop spaces to bars. Public room-rental and A/V revenue gains are the result of the initial stages of the recovery of conventions and meetings. The increase in service-charge revenue is reflective of the increased implementation of mandatory surcharges within hotel F&B outlets to offset the rising costs of operations. This is similar to the increase in hotel resort fees as a supplement to rooms revenue.
On the downside, we observed reductions in the amount of revenue earned on a POR basis from in-room dining and minibars during 2022. Social distancing requirements forced hotels to limit guest interaction within the guest room. Accordingly, the extent of in-room dining service has been reduced and replaced with the increased use of grab-and-go operations. In addition, hotels have frequently removed mini-bars from guest rooms in favor of providing mini-refrigerators for guest use.
When analyzing changes in food and beverage revenue by property type and chain-scale, we see consistency with recent changes in hotel demand. From 2021 to 2022, the greatest F&B revenue POR gains were achieved by full-service, convention, and upper-upscale hotels. In general, full-service, convention, and upper-upscale hotels benefited the most in 2022 from the initial stages of the recovery of group and corporate demand.
In 2023 we have seen a slowdown in total F&B revenue growth. From January through June of 2023, total F&B revenue has increased by just 11.3 percent from the first six months of 2022. It should be noted that most of this gain occurred in January of 2023 when comparisons were extremely favorable to the Omicron-depressed performance in January of 2022.
Luxury hotels have struggled the most to grow F&B revenue in 2023. This is consistent with the inability of luxury hotels to increase room rates during the year. It has become apparent that the double-digit growth in luxury hotel room rates and F&B prices enjoyed during 2021 and 2022 has proven to be unsustainable in 2023.
Expense Trends
From 2021 to 2022, total F&B department expenses at the hotels in our sample increased by 82.3 percent. For comparative purposes, this is significantly greater than the 63.5 percent rise in expenses for all operated departments. Among all the expenses within the hotel F&B department, the greatest increase was observed in the combined costs for salaries, wages, and employee benefits. From 2021 to 2022, total F&B department labor costs increased by 85.9 percent. This growth in labor costs is primarily attributable to the increase in employee wage rates, as opposed to hours worked. Supplemental analyses performed by CBRE and other firms have found that hotels are operating with fewer employees and hours worked compared to pre-COVID levels. The combination of rising labor costs and a reduction in available employees and hours worked has been a significant influence on the decision to reduce the levels of food and beverage service at hotels.
Among the other expenses within the F&B department, the cost-of-goods sold rose by 73.5 percent in 2022, while all other department expenses (supplies, tabletop utensils, uniforms, etc.) grew by 84.2 percent.
Profit Trends
The previously referenced trends in hotel F&B revenues and expenses resulted in a healthy 145.2 percent increase in F&B department profits from 2021 to 2022. This growth in profits was not only attributable to the increases in revenue but enhanced operating efficiencies in the department as well. F&B department profit margins increased from 21.3 percent in 2021 to 25.8 percent in 2022. Following revenue trends, the greatest gains in F&B department profits during 2022 were achieved by convention and upper-upscale hotels.
Unfortunately for hoteliers, the revenue slowdown in 2023 has also resulted in a deceleration of profits gains. Through June of 2023, F&B department profit growth has slowed down to 14.2 percent. Struggling the most are luxury and resort hotels that have seen profit growth of 0.7 percent and 7.1 percent respectively during the first six months of 2023.
F&B department operating efficiencies have also suffered in 2023. June year-to-date F&B department profit margins have dropped from 29.3 percent in 2022 to 28.3 percent in 2023, while department profit margins have declined in 2023 for all chain-scale and property type categories. The lone exception has been upper-upscale hotels whose F&B department profit margins have increase slightly from 32.8 percent to 32.9 percent during the first six months of 2023.
In early November, CBRE revised its forecast for the coming year to show growth is likely to recover in 2024, as inbound international travel further improves and sector-specific headwinds moderate, according to CBRE. CBRE’s forecast indicated a 3 percent growth in RevPAR, propelled by a 40 basis-point occupancy boost and a 2.3 percent increase in ADR.